This article is the second installment in the “Inside Azure AIOps” series. This time, I will dive in how Microsoft’s been advancing incident management with AIOps.
- Inside Azure AIOps #1: Introduction
- Inside Azure AIOps #2: Incident Management
- Inside Azure AIOps #3: Resource Management
Incident Management and AIOps Link to heading
What is Incident Management? Link to heading
Incident Management is the process of promptly and effectively resolving issues that occur within systems or services. It not only involves resolving the incidents but also identifying their root causes and taking measures to prevent future incidents. Therefore, incident management is an continuous effort and is recognized as a critical process in IT service management.
The typical lifecycle of an incident is as follows:

Incident management steps
| Step | Description |
|---|---|
| Prediction | Predicts the occurrence of failures based on observational data. Measures are taken to prevent predicted failures in advance, or plans are prepped to respond if the failure occurs. |
| Detection | Detects ongoing incidents. Incidents are identified through various means such as user reports, monitoring system alerts, and log analysis. |
| Triage | Evaluates the severity and impact of the detected incidents, and assigns priorities (priority levels). Additionally, service teams or on-call engineers (OCE) are allocated to resolve the incidents. |
| Diagnosis | Collects information to consider mitigation strategies. In this step, it is crucial to quickly understand the incident situation, without necessarily identifying the root cause. |
| Mitigation | Takes and implements measures to return the system to a stable state. Various methods such as rollback of settings and system reboots are utilized to mitigate the incident. |
| Root Cause Analysis (RCA) | Identifies the root cause of the incident by investigating monitoring data and codebases. Measures are also taken to prevent the recurrence of the same incident. |
| Resolution | Confirms that the root cause has been resolved through actions like hardware replacement, patch application, or configuration changes, and then closes the incident. |
Incidents can occur due to various factors such as hardware failures, software bugs, or incorrect user operations. It’s important to note that incidents and failures are often confused, but they are distinct concepts. A failure refers to the state where a system’s functionality is not operating correctly, while an incident refers to a state where the user is affected.
However, in the context of AIOps, incidents and failures are often not clearly distinguished. This is likely because the primary concern is the normality/abnormality of the system state rather than the presence or absence of user impact. Therefore, in this article as well, we will not particularly differentiate between incidents and failures.
Tasks Covered by AIOps Link to heading
Essentially, the tasks addressed by AIOps correspond to the steps in incident management. For example, detecting early signs of a disk failure tackles the “Prediction” problem. However, even if the focus is on a specific step, it often covers multiple steps in practice. For instance, if the goal is the automation of “Mitigation,” the design typically takes into account the “Diagnosis” phase too.
Plus, AIOps also handles more general tasks, such as:
- Data Preprocessing: Preprocessing monitoring data to derive important insights (e.g., log filtering, missing data imputation).
- Incident Correlation: Discovering similar incidents (e.g., pre-preparation for triage, aggregating support requests stemming from the same failure).
- Automation: Streamlining various operations into pipelines for automatic control (e.g., automated execution of troubleshooting tools).
- User Experience: Designing a UX that is easy for incident responders to understand (e.g., summarizing failure details using LLMs, establishing verification steps through Human-in-the-Loop).
- Visualization: Visualizing data for an intuitive understanding of the system status.
Common Metrics (KPIs) Link to heading
The metrics used in incident management include the following:
| Metric | Full Name | Description |
|---|---|---|
| MTTD | Mean Time to Detect | Average time from the occurrence of an incident to its detection |
| MTTT | Mean Time to Triage | Average time from the detection of an incident to its assignment to the appropriate responder |
| MTTM | Mean Time to Mitigate | Average time from the detection of an incident to its mitigation |
| MTTR | Mean Time to Resolve | Average time from the detection of an incident to its resolution |
| COGS | Cost of Goods Sold | Indicates the direct costs related to delivering a product or service, used in profit margin calculations |
Ultimately, AIOps aims to improve the same metrics, targeting enhancements in indicators like MTTD and MTTM. However, when machine learning models are employed, their predictive performance is also a crucial metric.
Incident Management at Microsoft Link to heading
In Microsoft’s production environments, incident management follows similar steps described eariler. The overview of an incident’s life cycle from detection (prediction) to resolution is as follows.
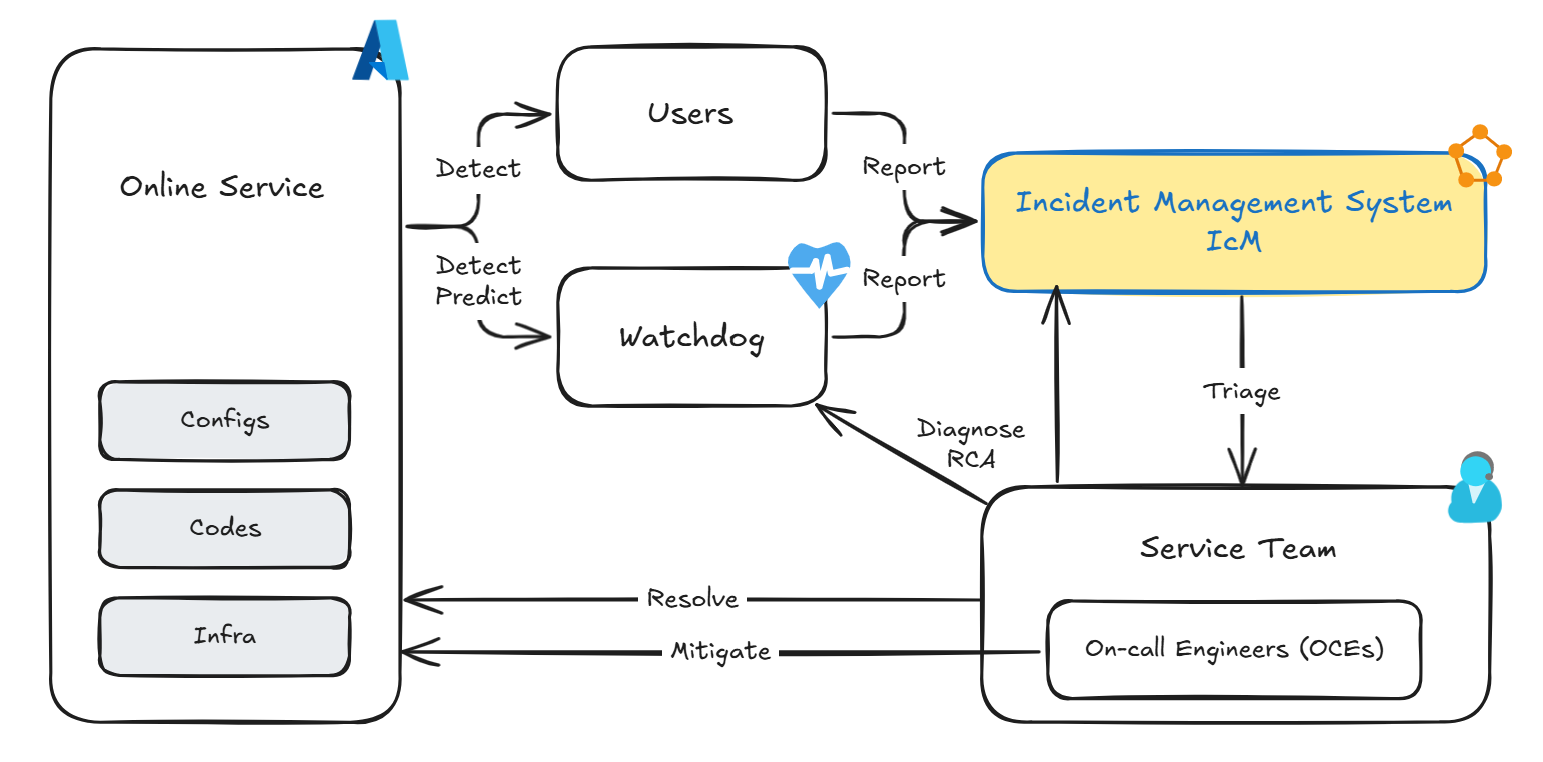
Incident Management process in production systems at Microsoft
Incidents are created in response to reports from either users or monitoring systems. All incidents are centrally managed by the Incident Management System (IcM). In IcM, not only are the attributes and descriptions of incidents recorded, but discussions among engineers are also exchanged. Incidents with high priority are promptly assigned to an on-call engineer (OCE), who plays a main role in mitigation. After the symptoms are alleviated, the incident is handed over to a service team for root cause analysis (RCA) and resolution.
AIOps primarily targets the optimization of monitoring systems and IcM systems. The focus is on improving prediction accuracy, preventing false detections and missed detections, and providing more accurate diagnostic information, thereby speeding up the time to mitigation and resolution.
For those interested in more details, please refer to the following papers:
- An Empirical Investigation of Incident Triage for Online Service Systems - Microsoft Research
- Identifying linked incidents in large-scale online service systems - Microsoft Research
- Towards intelligent incident management: why we need it and how we make it - Microsoft Research
- What bugs cause production cloud incidents? - Microsoft Research
- Fast Outage Analysis of Large-scale Production Clouds with Service Correlation Mining - Microsoft Research
- X-Lifecycle Learning for Cloud Incident Management using LLMs | Companion Proceedings of the 32nd ACM International Conference on the Foundations of Software Engineering
How Microsoft Leverages AIOps in Incident Management Link to heading
Now, we all set to dive into the main topic. I’ll explore the various technologies that have been developed and implemented within Microsoft.
A New Mitigation Paradigm through Failure Prediction Link to heading
“An ounce of prevention is worth a pound of cure.” —— Benjamin Franklin
By catching early signs of anomalies before failures occur, we can significantly reduce user impact and improve reliability.
This is precisely why Microsoft has invested years in predictive failure technologies. The initial targets were baremetal servers hosting VMs (nodes) and the disks attached with those nodes, as they are some of the most critical resources to keep VMs running.

Node Failure Prediction and Disk Failure Prediction
- Node Failure Prediction: In 2018, the node failure prediction system “MING” was introduced1. MING stands out by combining deep neural networks with traditional machine learning models, allowing it to handle both temporal data and topological information simultaneously. Data shows that for the top nodes predicted to have high failure rates by MING, 60% failed the next day. Additionally, continuous improvement of node failure prediction models through a method called “Uptake” was developed by 20242.
- Disk Failure Prediction: In 2018, the disk failure prediction system “CDEF,” leveraging SMART data, was deployed3, and it was refined into “NTAM” in 20214. NTAM improves accuracy by processing information from multiple disks collectively, not just individually. This process has incorporated feature generation techniques using neural networks5 and methodologies using reinforcement learning to address imbalanced training data6.
Node and disk failure predictions enable proactive mitigation actions based on forecasts. For example, Azure’s virtualization platform offers live migration that allows VMs on faulty nodes to be moved to healthy ones, minimizing impact (Note: the blackout period is usually just a few seconds7).
As a result, a new Azure virtualization platform management system called “Narya” was introduced in 2020, premised on predictive mitigation89.
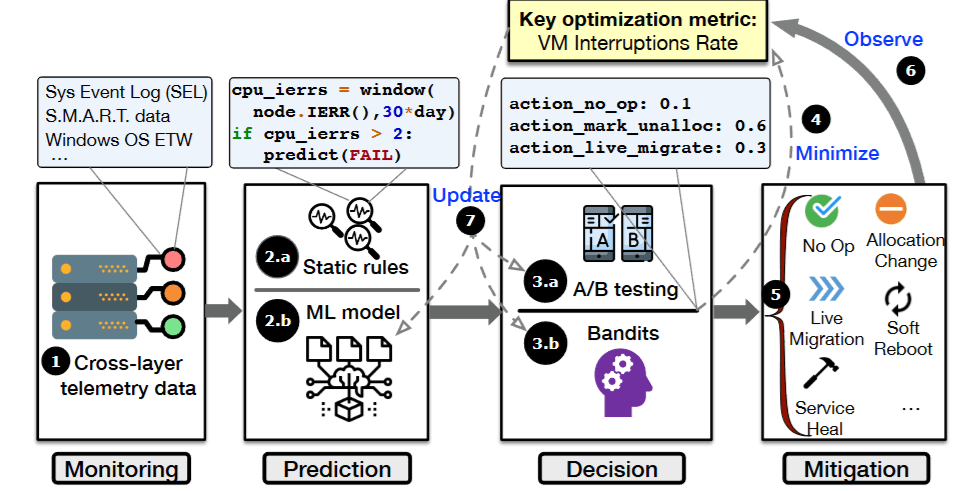
Architecture of Narya
One of the problems Narya addresses is the learning of action policies. It needs mechanisms that adapt behavior depending on the situation (e.g., predicted failure probability, the component where a failure might occur, the number of virtual machines hosted), and that make adjustments from results. This type of problems has been studied within the realm of reinforcement learning, specifically Multi-Armed Bandit.
These cumulative efforts significantly contribute to reducing VM interruption events and enhancing the reliability of the Azure platform. In terms of AIR (Annual Interruption Rate)10, Narya has successfully achieved a 26% improvement over a static action policy.
Lastly, inspired by Narya’s success, a similar orchestration system called “F3” was also developed11. F3 integrates necessary features for proactive mitigation such as drift monitoring, pre-processing log data, augumentating imbalanced data, and learning action policies based on Reinforcement Learning techniques.
Quality Assurance for GPU Nodes Link to heading
Recently, Microsoft has been doubling down its AI infrastructure, which includes components like GPUs, NPUs, and high-speed interconnects12131415.
As implementing it, Microsoft has faced a unique set of challenges, one of wich is that GPU nodes are prone to failures. The potential causes for these failures may include:
- 📉 Hardware Regression: AI-centric processors are released every 1-2 years, and there might not be enough regression testing conducted. Simple micro-benchmarks (e.g., GEMM, NCCL Tests) might not catch all regressions that manifest only under specific workloads.
- ⚖️ Differences in Environments: The conditions in vendor test environments differ from those in cloud data centers, particularly regarding factors like power and temperature. For example, Microsoft’s data centers have observed that the number of abnormal InfiniBand links, exceeding the bit error rate required by the specification (10E-12), is 35 times higher in tropical regions. As such, environments play a huge role in diverse failure patterns.
- 👶🏻 Immature Software Stacks: As hardware evolves, the application layers need to be updated as well. Software stacks like CUDA or ROCm release new versions every few months, making it challenging to maintain a highly reliable stack.
Moreover, the nature of AI infrastructure, with high redundancy across various layers (e.g., row-remapping in NVIDIA GPUs16), often leads to gray failures and complex and time-consuming troubleshooting.
Thus, it is preferred to prevent failures before they occur, one method being Quality Assurance (QA). QA involves running benchmark tests to check the health of nodes before they are deployed in production. However, given the countless AI workload patterns and the high cost of infrastructure, running comprehensive benchmark tests is impractical.
This is where “SuperBench”17 comes into play. It is a system introduced in 2024, designed to effectively eliminate aberrant GPU nodes before deploying them, through a combination of machine learning and benchmarking.
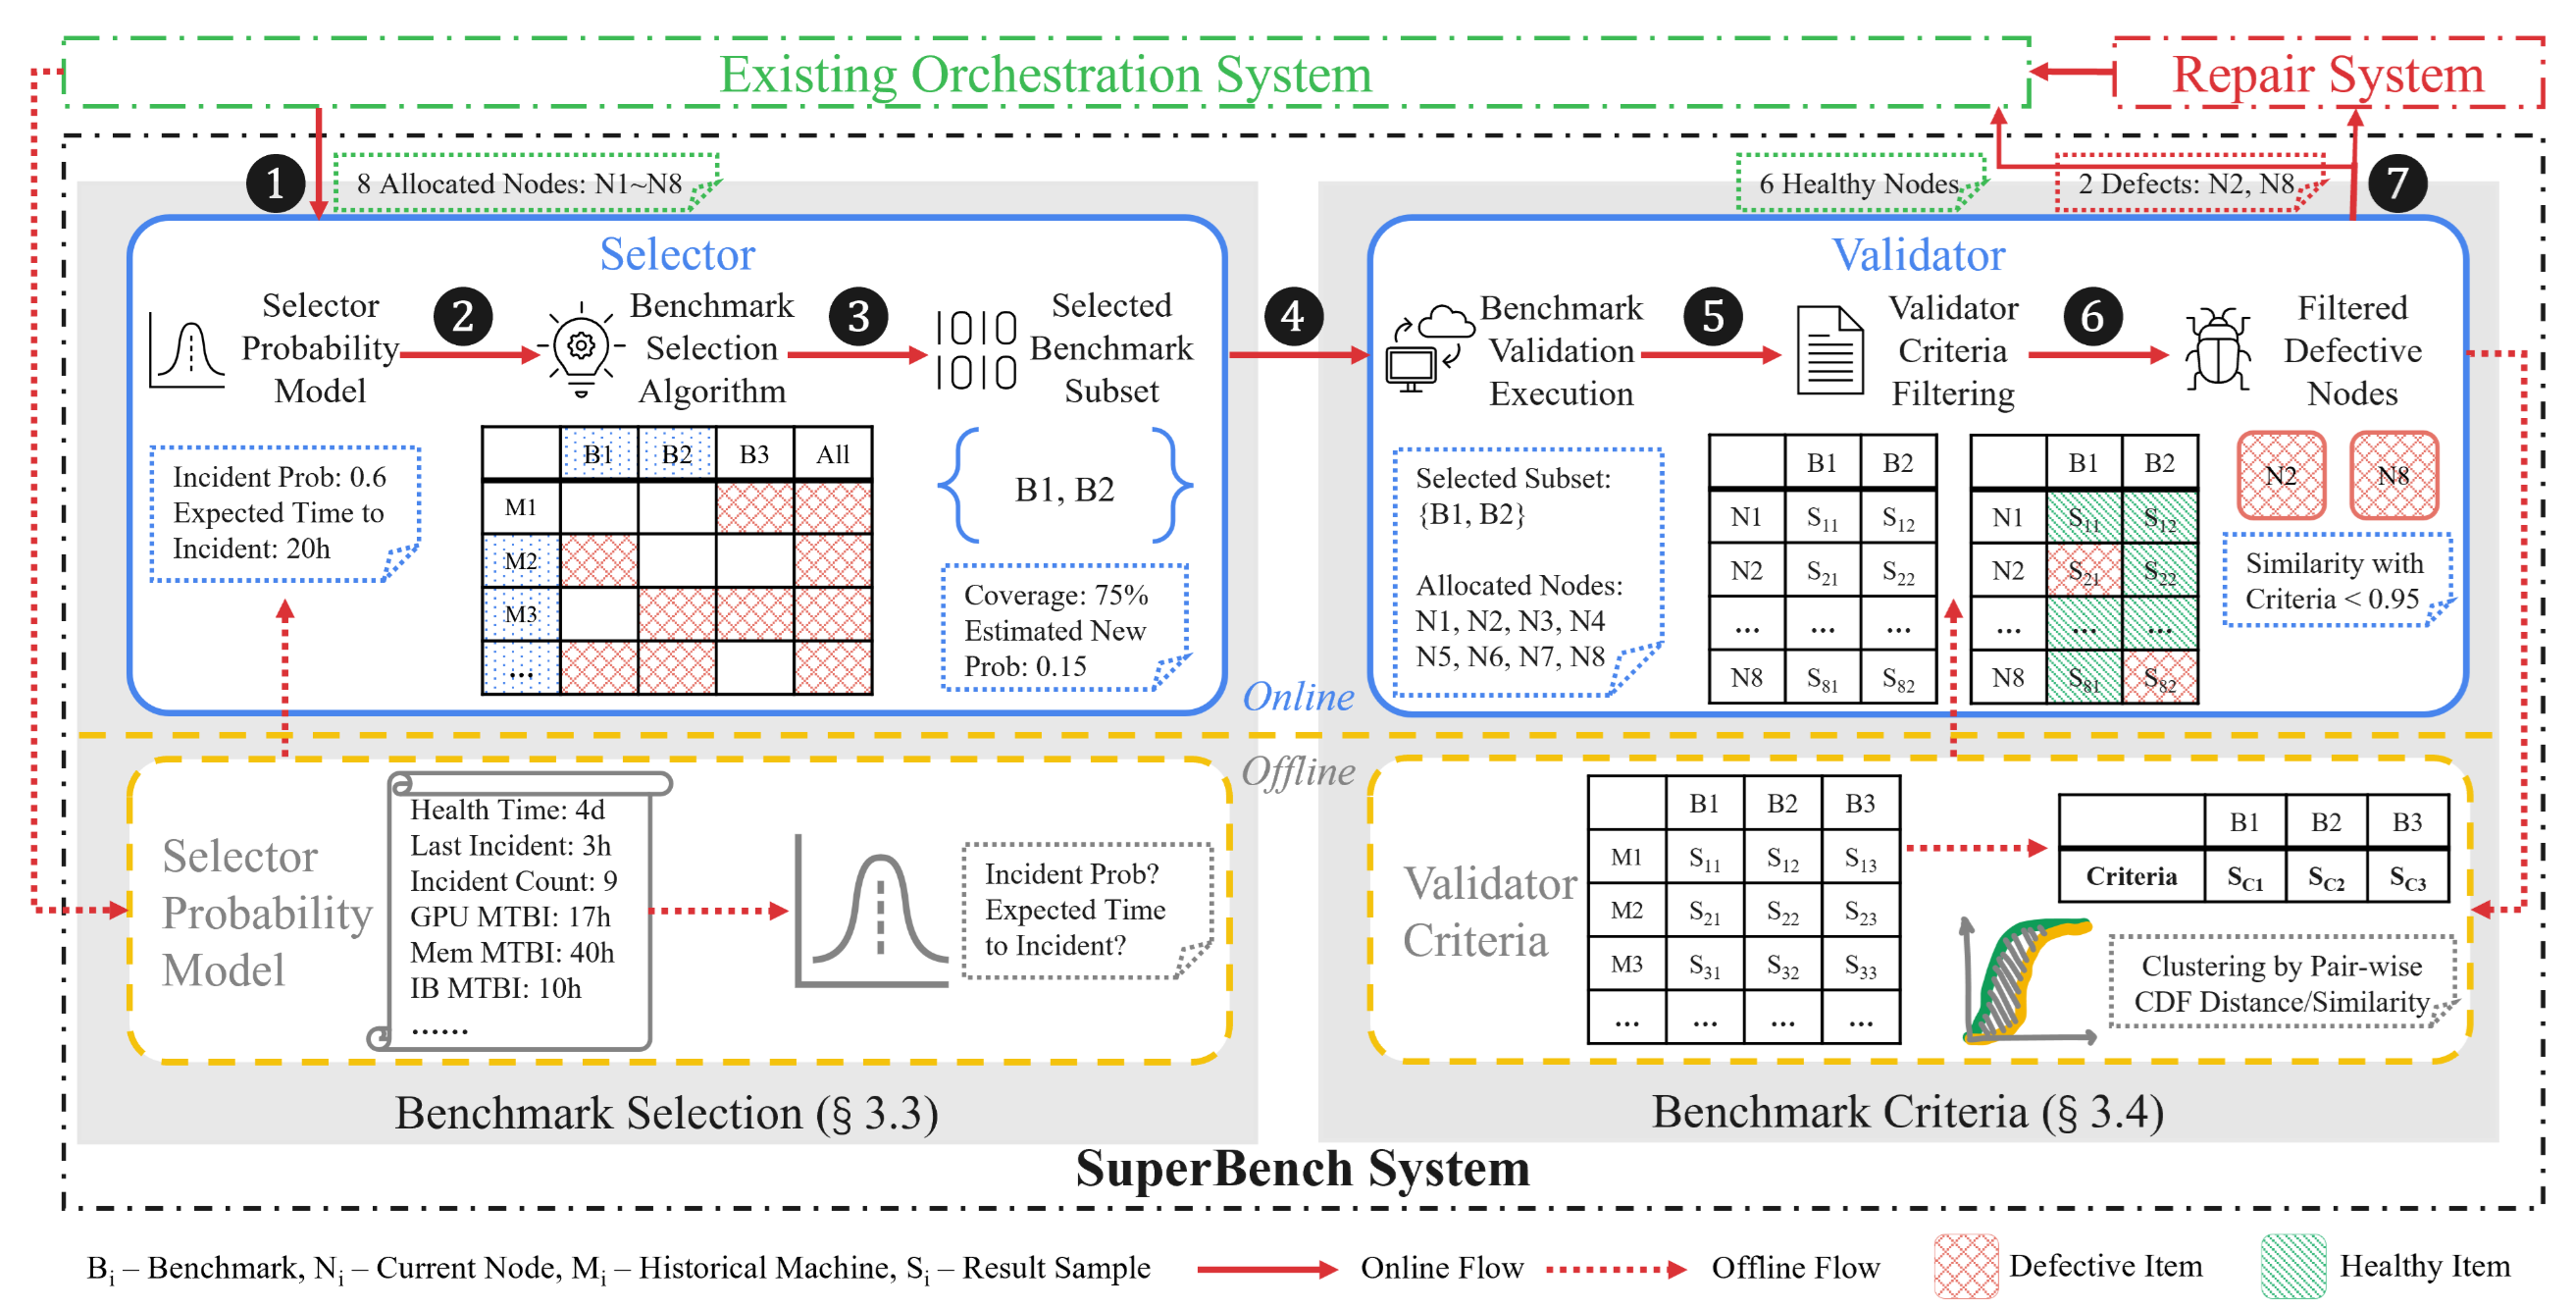
SuperBench Execution Flow
Given some nodes to be tested, SuperBench first predicts the risk of failure with a statistical model called Cox-Time. If the risk is deemed high, the system selects the most appropriate set of benchmarks to identify potential node issues. While it is not trivial to select the thresholds for each benchmark, SuperBench uses machine learning models to derive baseline values. It then evaluates the benchmark results for anomalies and outputs a final decision (go/no-go for each node).
SuperBench is already operational in Azure’s production environment and has identified issues in approximately 10% of nodes before production deployment within two years of operations.
Practical Alert System Incorporating Machine Learning Link to heading
Fault detection is a challenging task because there are countless “anomalous” patterns in a system, making it difficult to accurately define alert rules.
At Microsoft, despite years of operating online services and continuous efforts, both false positives (detected but did not require action)18 and miss-detections (failures in detecting an issue before it impacts) occur at a consistent frequency19. Additionally, it was understood that a major reason for detection misses was the inadequacy of alert rules, highlighting the difficulties in defining what constitutes an “anomaly.”
Given this backdrop, machine learning approaches have been actively researched, and in recent years, anomaly detection models using deep neural networks for time series data have garnered attention20. However, despite academic success, these models have not been extensively applied in practice. Microsoft has summarized the reasons for this into the following three points:
- Selection of models and hyperparameters: The optimal model varies depending on the nature of the time series data, so it is necessary to choose the best model for the workload being monitored. Additionally, the model’s hyperparameters need to be determined. When dealing with numerous metrics, manual selection is unrealistic.
- Interpretation of anomalies: Some fluctuations in metrics might be considered faults, while others might not. Practical fault detection requires a mechanism to identify and manage the waveform patterns considered “anomalous” from a service perspective, but existing models usually do not provide such interpretability.
- Handling data drift: Models need to be continually updated as the characteristics of the data change. However, only a limited number of engineers (e.g., data scientists) can retrain the models, and service teams cannot provide feedback.
To overcome these challenges, a practical metric-based fault detection system called “MonitorAssistant” was introduced21.

Architecture of MonitorAssistant
MonitorAssistant registers machine learning models in advance like a catalog and suggests the optimal model for a given metric. To enhance model interpretability, it can classify anomaly categories (e.g. sudden spike). Furthermore, service teams can firsthand give feedback through a chatbot (LLM) to adjust the model in case of false detactions or misses, without involving data scientists in the loop.
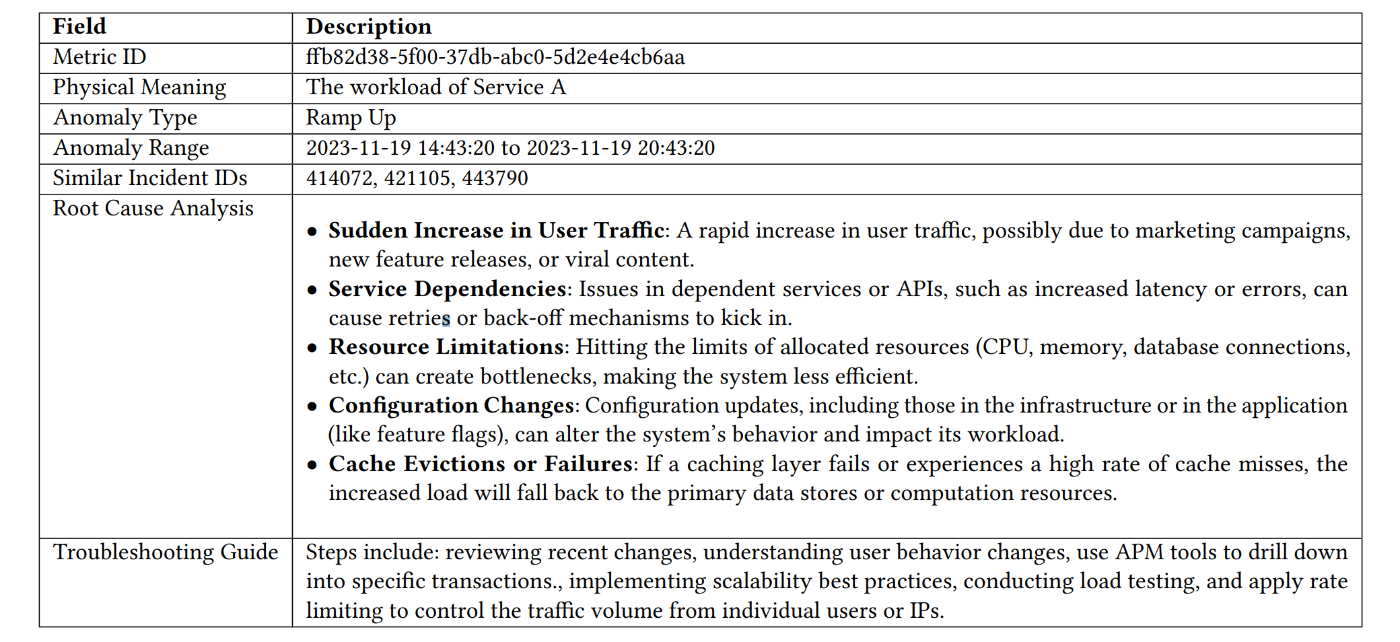
Example report generated by MonitorAssistant
Exploring Effective Attributes of Multidimensional Data Link to heading
When utilizing metrics, the use of attributes (aka dimensions22) is crucial, as you will end up with different outcomes depending on how to filter metrics on those attributes.
Consider a management system that collects incident reports from servers worldwide. These reports are tagged with various attributes such as server name, data center name, customer, and country. Suppose a service for educational customers deployed in the 6th data center in India went down.
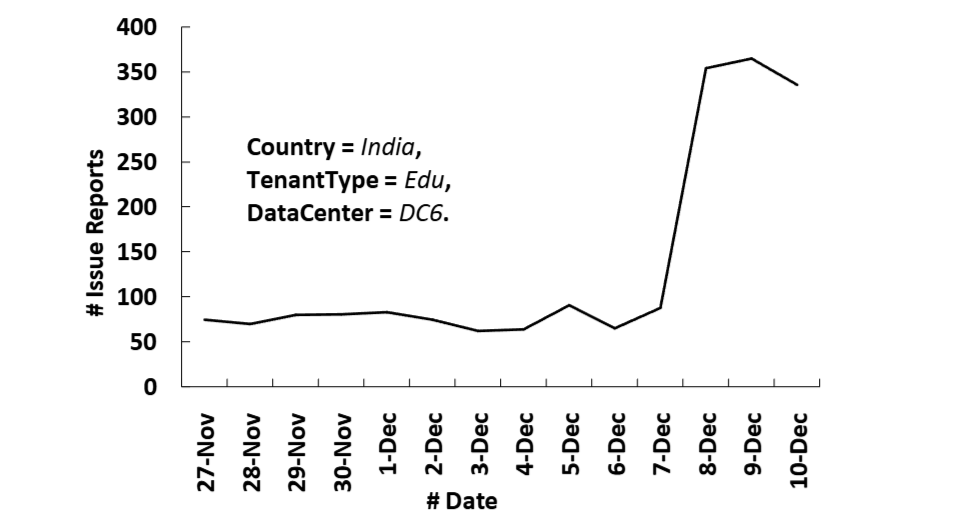
The number of incidents filtered by attributes (country, customer type, data center) over time
If you have an appropriate attribute set to filter out as in the figure above, you should be able to clearly see an increase in incidents. However, if you view the same time-series data without filtering by attributes, the incidents reported from all over the world would be leveled out, making it difficult to pinpoint any anomalies.
Thus, in multivariate data anomaly detection, exploring such an effective set of attributes for filtering is crucial. Typically, this task is performed iteratively by humans, but as the number of attributes grows, it becomes unmanageable due to combinatorial explosion.
To address this, Microsoft approached the exploration of effective attributes as a tree structure search problem where nodes represent combinations of attributes, and developed an incident detection system called “iDice”23. Additionally, in 2020, they tackled a new method (MID) to reduce the search space using metaheuristics24. These outcomes have been successfully applied in Azure as AiDice25.
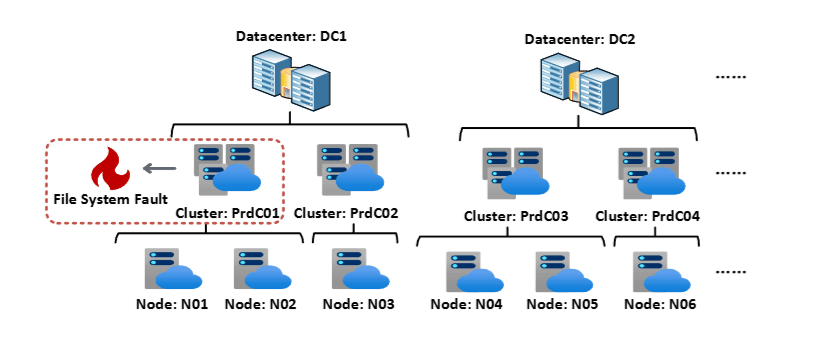
Example of using attribute exploration for fault identification
There’s a similar initiative dubbed “HALO”26. HALO targets any multidimensional metrics associated with servers (e.g. API call failure counts) and identifies attribute sets where anomalies (server faults) are occurring. What’s unique about HALO is it can take into account the topological information of servers in datacenters. HALO has been implemented in Azure’s Safe Deployment management system (Gandalf27) to detect deployment issues when rolling updates or fixes to canary/production environments.
Responding to Outages Link to heading
Incidents with a significant impact on a number of services and users are referred to as outages, and one of the important steps to tackle them is identification. While one can suspect an outage if similar reports come in from multiple users, significant time may have already passed by that time. It is more preffered to systematically detect outages early on, without waiting for user reports.
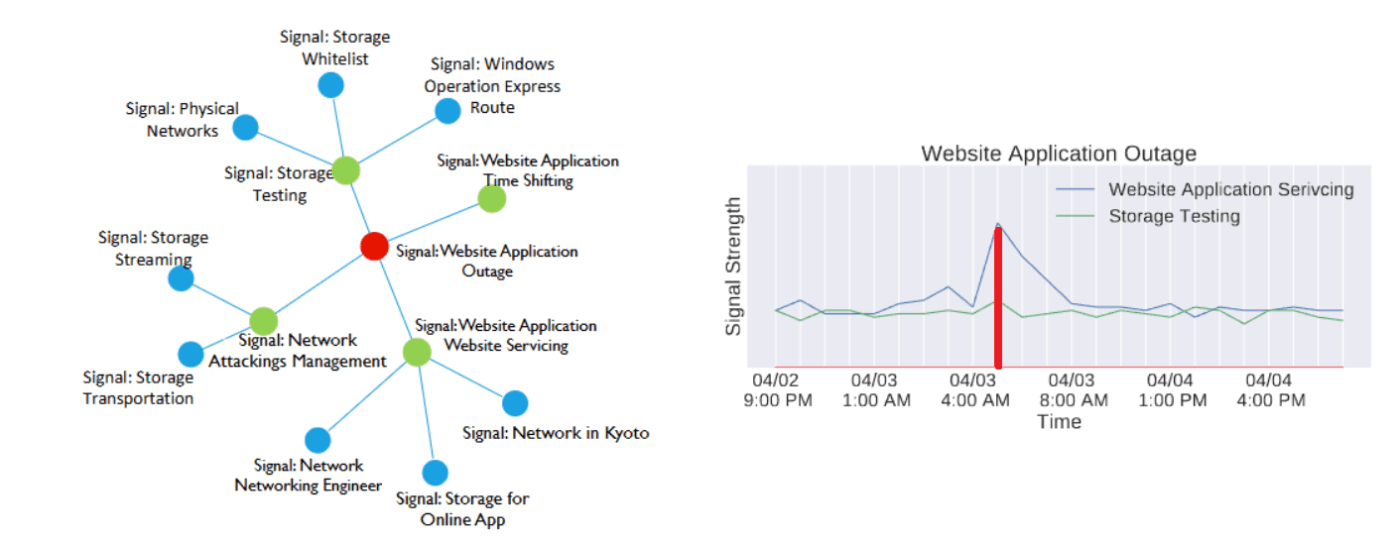
Left: Bayesian network constructed by AirAlert, Right: Trends of metrics deemed related
To achieve this, the following two siblings were born:
- Microsoft first developed “AirAlert,” a method for detecting outages using Bayesian networks28. It applys a causal inference method to model the dependencies between the alerting signals and outage as a directed acyclic graph (DAG). This allows for extracting the set of signals most related to the outage, thus inferring the occurrence of an outage.
- Furthermore, a new detection method called “Warden” was introduced for the higher accuracy29. While AirAlert only utilizes the number of alerts when constructing a DAG, Warden can factor in diverse information such as OCEs’ discussions, achieving substantial performance improvement.
Once an outage has been identified, engineers move to the investigation phase, for which Microsoft has introduced a supporting tool called “Oasis” in 202330.
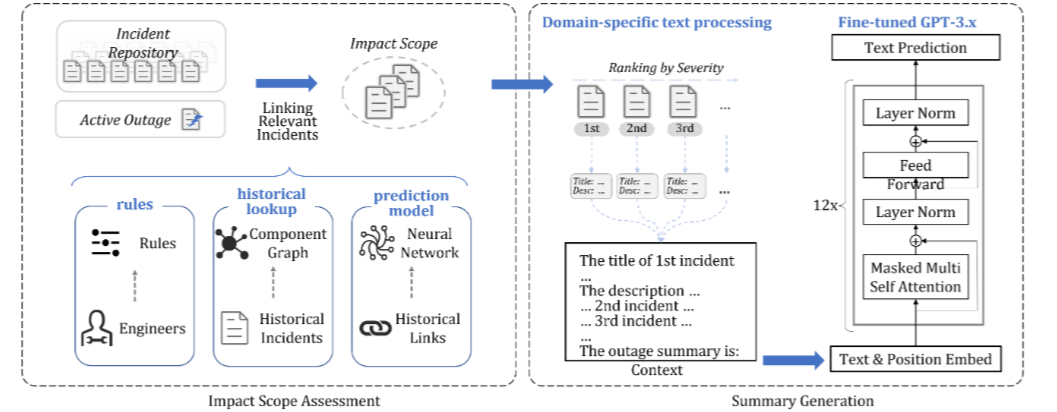
Flow of Oasis scoping and summarizing an outage
Oasis is a system that identifies the impact scope of an outage by linking relevant incidents and generates summaries using LLMs. Oasis enhances accuracy by using three different linking methods in combination:
- Rule-based linking: Leveraging the domain knowledge of engineers
- Component dependency-based linking: Utilizing service or topological dependencies between components previously associated in past outages
- Machine learning model-based linking: Employing machine learning models to predict links between incidents, such as LiDAR31 or LinkCM32
Finally, here is a sample summary generated by Oasis. It provides sufficient information to easily understand the content of the outage, the services impacted, and its severity.
Outage Summary by Oasis: The API failed with HTTP 5xx errors (over 𝛼_1 fall failures) because of bad gateway errors to the endpoint_1. Due to this issue, commercial customers could not sign-up for System-Cloud or SystemProductivity via endpoint_2 or endpoint_3, and perform management related actions on endpoint_4. Additionally, System-Cloud users were not able to access their billing accounts and invoices on System-Cloud portal. Approximately 𝛼_2 unique users were impacted.
Improving Triage Efficiency Link to heading
Reflecting on the history of incident triage in Microsoft takes us back to the days of online services before Azure’s birth (e.g. Office 365, Skype).
Back then, when an incident was created, the system would make phone calls to multiple on-call engineers. Engineers would manually assess the priority and assign the appropriate response teams33. This method consumed a lot of engineers’ efforts and loads, highlighting the need for an automated triage system.
The first attempt was to repurpose existing methods that automatically assign bug reports to software engineers33. While this approach demonstrated some applicability, the fundamental differences between bug reports and online service incidents concluded that a method tailored to online services was necessary. Subsequently, the following endeavors were explored:
- In 2019: A continuous incident triage system called “DeepCT” was proposed34. Considering that the assignment of incidents could occur multiple times as investigations progressed, DeepCT learned from engineers’ discussions and continuously updated the triage results.
- In 2020: An improved system over DeepCT, called “DeepTriage,” was deployed in production35. While DeepCT relied on a deep neural network to classify the responsible team, DeepTriage enhanced accuracy using an ensemble of multiple models, including LightGBM36 developed by Microsoft.
- In 2020: A method named “DeepIP” was proposed to filter out alerts that did not require action (false positives) and adjust their priority37. In this study, preliminary research revealed that over 30% of the alerts were false positives, and a deep learning-based prioritization was implemented.
- In 2021: A prediction method called “TTMPred” was proposed to estimate the time required to mitigate an incident (TTM), enabling appropriate personnel allocation38. TTMPred used recurrent neural networks (RNNs) to capture the progression of discussions and text information.
The latest development is the proposal of a new incident triage system called “COMET” in 2024, which leverages LLMs39.
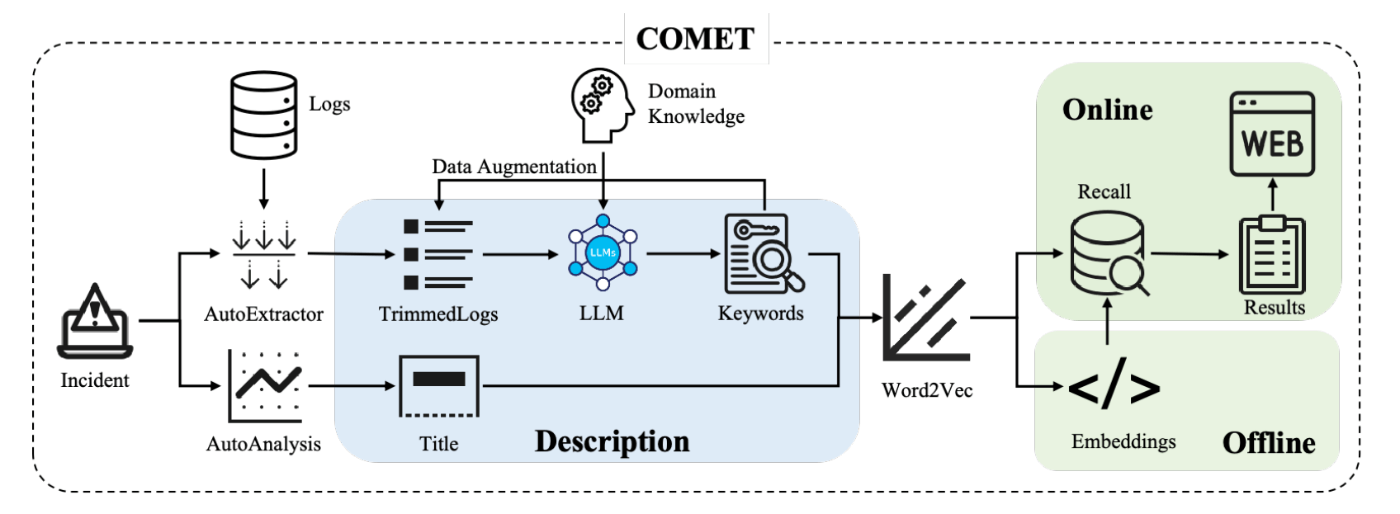
Architecture of COMET
One of COMET’s notable features is its effective handling of logs during triage. Logs of components related to the incident contain crucial information needed for triage, but handling these logs with machine learning models requires addressing original challenges such as trimming redundant logs, extracting important keywords, and dealing with data imbalances. COMET tackles these issues using a mix of existing log processing engines and LLMs (w/ In-Context Learning).
Additionally, COMET provides a feature to report analysis results along with incident triage. In an actual incident management system, analysis results by COMET are presented as follows:
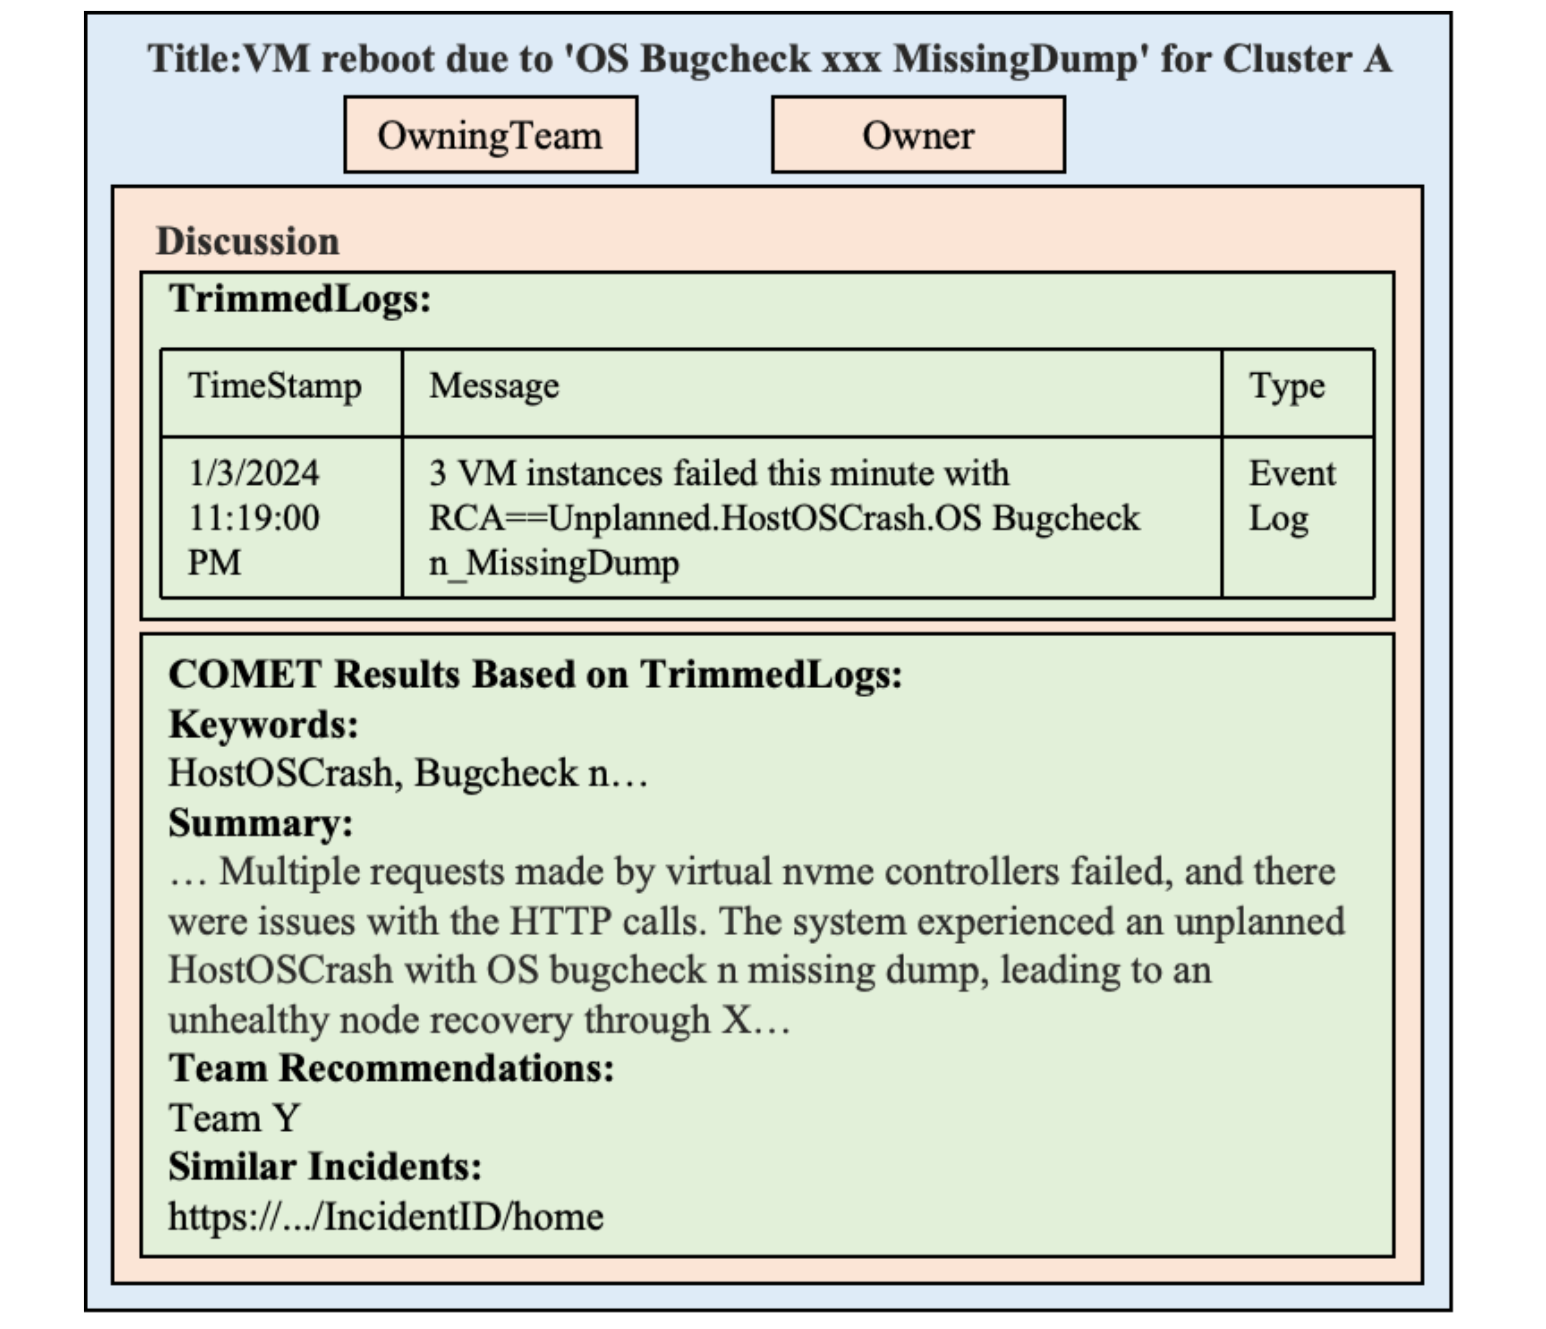
Report presented to on-call engineers by COMET
This exemplifies how COMET is not just a triage system but also provides critical insights. Performance evaluation has shown a 30% improvement in triage accuracy and up to a 35% reduction in TTM (Time-To-Mitigate). COMET is currently in operational use for internal services offering virtual machines.
Linking Associated Incidents Link to heading
Identifying and linking similar incidents is beneficial in many aspects of incident response. For instance:
- Due to dependencies between services, incidents can cascade and spread across components (known as cascading failure).
- The same issue can trigger mutiple alerts or be reported by multiple customers.
- Related past incidents can provide crucial hints during investigation.
Microsoft has devised and implemented various methods for incident association.
In 2020, Microsoft introduced “LiDAR,” an incident association system for online services inspired by methods used to detect duplicate software bug reports31. LiDAR uniquely considers both the textual information of incidents and dependencies between components. Using neural network-based techniques, it extracts features from both sources of information to calculate similarities between incidents.
The same year, a method called “LinkCM” was proposed for associating customer-reported incidents (CI) with incidents automatically logged by monitoring systems (MI)32. This was motivated by the fact that while 77% of CI had corresponding MI logged beforehand, only about 20% were correctly associated early in the investigation. LinkCM interprets the descriptions in natural language from CI and uses deep learning-based methods to link them with MI.
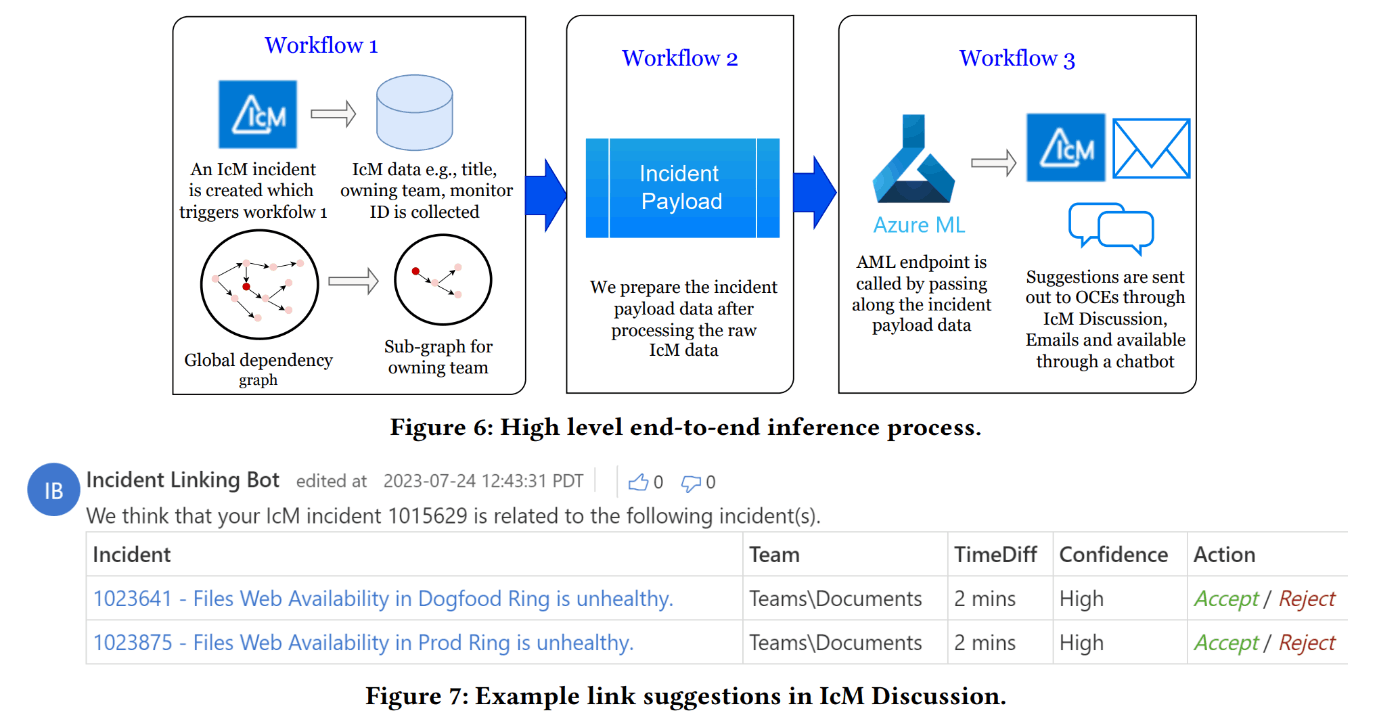
DiLink Architecture
In 2024, a new incident association system called “DiLink” was proposed, evolving from LiDAR31. Both LiDAR and DiLink utilize textual information and dependency graphs between components as features. However, while LiDAR learned these features using separate models, DiLink achieves more accurate, multimodal incident association by handling textual and dependency graph information in a single neural network.
Generation of KQL Queries Link to heading
In Microsoft’s monitoring systems, it’s common to issue queries using a domain-specific language called Kusto Query Language (KQL).
Troubleshooting using KQL is not an easy task. Engineers need to learn the KQL syntax40 and become familiar with the data schema they are looking into. Even with troubleshooting guides, these may be outdated or ineffective for unknown issues. Thus, on-call engineers frequently find themselves having troubles with KQL.
To address this, a system named “Xpert” was developed to automatically generate KQL queries41. Integrated into the incident management system, Xpert automatically collects information from similar past incidents and generates new KQL queries based on queries used during previous responses. This generation process leverages the context-based learning capabilities of large language models (LLMs) via few-shot learning.
Additionally, the generated KQL queries are designed to maximize a unique metric called Xcore, which is a quality evaluation metric for queries (or code) that can be applied to any DSL. It assesses the quality of queries based on multiple perspectives such as syntactic and semantic accuracy, the correctness of tokens and operations, and the comprehensiveness of information necessary for the investigation.

Architecture of Xpert
Xpert adopts an architecture similar to general RAG (Retrieval-Augmented Generation) systems but with a notable post-validation process. In the post-processing phase, the LLM-generated query is validated by parsing to ensure it adheres to KQL syntax. If an incomplete query is generated, the system retries by querying the LLM again for corrections. Moreover, the database that stores incident information and past queries is continuously updated, improving accuracy over time and addressing data drift issues.
Automating Troubleshooting Guides Link to heading
A team at Microsoft working on hybrid cloud products faced challenges with their troubleshooting guides (TSGs): their TSGs were excessively long (a median of 815 words, with some extending up to 5000 words!). While the automation of TSGs was considered, automating codes or scripts requires maintenance with every TSG update. This team had a high frequency of TSG updates, averaging every 19 days, making it difficult to implement full automation.
To address this, a system named “LLexus” was introduced to interpret and execute TSGs written in natural language, powered by LLMs42. It is much like the Java runtime, compiling TSGs into the middle language (plans) that can be executed by the LLexus Executor when an incident occurs.

Architecture of LLexus (figure extracted from the paper)
An interesting aspect of LLexus is its separation of the Planner and Executor. When the Planner detects an update to a TSG, it interprets the content with LLMs (combining a technique called Chain of Though) and converts it into an executable plan for the Executor. When an incident occurs and the relevant TSG matches, the plan is executed by the Executor.
This two phase model reduces the cost of invoking LLMs, as there are a greater number of incidents than TSG updates and LLM calls are only made when a TSG is updated. Moreover, LLexus incorporates a Human-in-the-Loop mechanism, where feedback from engineers is immediately given whenever a plan is created from an updated TSG. Plus, by virtue of the fact that incomprehensible and verbose TSGs are likley to fail in being compilied, engineers are incentivized to create more concise and understandable TSGs, bringing benefits to both the system and the engineers.
Root Cause Analysis with LLM Link to heading
A Microsoft team working on an email delivery service, which sends 150 billion messages daily, needed to optimize their root cause analysis flow for the frequently occurring incidents. After analyzing all incidents from a year, they derived the following insights:
- Insight 1: It is difficult to identify the root cause using a single data source.
- Insight 2: Incidents stemming from the same or similar root causes have temporal correlations (if they recur, it usually happens within a short timeframe).
- Insight 3: A significant number of incidents arise from new root causes, with approximately 25% of incidents being novel phenomena.
Particularly important is Insight 3, indicating that for 25% of incidents, existing troubleshooting guides (TSGs) are not very effective.
To assist with root cause analysis, an AI-assisted system called “RCACopilot” was developed43. Despite having “Copilot” in its name and implying extensive use of LLMs, it is actually a well-designed automation system where LLM only plays a limited role in summarizing logs.

Architecture of RCACopilot
The system follows the following stages:
- When RCACopilot recognizes an incident, it starts with the information gathering stage.
- Adhering to Insight 1, it collects information from as many data sources as possible. A predefined logic flow, registered in advance similar to a directed acyclic graph, guides the data collection process (e.g., collect this log, then run this command, then conditionally branch…). Engineers can modify these flows anytime.
- After information gathering, the system moves to the root cause prediction stage.
- This stage involves searching for similar past incidents. Embeddings obtained using FastText and the time intervals between incidents (based on Insight 2) are used to compute the similarity between incidents.
- Finally, the system leverages LLM. Since the root causes of past incidents are known, this information is passed as prompts to the LLM, asking, “Here are the logs for the current incident, along with logs and root causes of similar past incidents. Please determine which root cause corresponds to the current incident, or state if none apply, with reasons.” The response provided by the LLM is output as the final root cause analysis.
As of 2024, RCACopilot has been in use for over four years across more than 30 service teams. Despite defining information gathering flows being somewhat labor-intensive, many on-call engineers (OCEs) reported high satisfaction in surveys. This satisfaction can be attributed to the ability to save and reuse information gathering logic.
Effective Utilization of Logs and Traces Link to heading
Finally, let me introduce some approaches for utilizing logs. When handling logs in AIOps, you need to address the following challenges:
- Large Data Volume: The amount of log data generated by monitoring systems can reach hundreds of terabytes per day. To use logs for near-real-time incident response, data processing algorithms and pipeline infrastructures with the same throughput as ingestion are required.
- Difficulty in Parsing Logs: Parsing logs involves breaking down log messages into the templates and parameters used to generate them. This is akin to predicting the code that produced the message. Effective log parsing requires appropriate log clustering methods.
- Severe Data Imbalance: Training data for anomaly prediction models needs to include balanced data from both “normal” and “abnormal” times. However, abnormal data is typically extremely scarce, necessitating strategies (e.g., sampling) to address this imbalance.
From the perspective of reducing data volume, “Log2”, presented in 2015, is quite intriguing44. Log2 provides basic APIs (Begin and End) to measure the execution time of certain processes. This API records data only if the measured time significantly deviates from past measurements, minimizing unnecessary data recording.
In the following year, an incident linking system called “LogCluster” was introduced and its log processing technique is interesting45. Assuming that even a vast number of log sequences are actually derived from a limited number of codes, it aggregates logs into clusters (conceputually corresponding to codes) and extracts the representative values of those clusters.
The idea of clustering logs is also seen in other methods. For example, the 2018 method “Log3C”46 and the 2021 method “Onion”47 extract log clusters and then apply methods such as correlation analysis and symmetry analysis to detect anomalies and extract anomaly-related log data.

Onion Architecture
For log parsing, there are two notable methods introduced in 2022 by Microsoft:
- UniParser: A log parsing method using deep neural networks48. It uses an LSTM-based Token Encoder to learn log embeddings while combining contrastive loss with similar and dissimilar logs. This enables the acquisition of embeddings considering the semantics of each token and allows for fast inference.
- SPINE: A log parsing method designed to be executed in parallel in a distributed computing environment49. It uses a greedy bin-packing algorithm called “BestFit” to ensure an even distribution of workload (log sets) to the workers executing the jobs. Additionally, it addresses the diversification of logs driven by recent deployments of CI/CD by designing a model retraining loop based on feedback.
Lastly, let’s also introduce a method that effectively utilizes traces in addition to logs. A trace is a log taken to allow retrospective tracking of events processed across multiple components. “TraceLingo,” proposed in 2021, leverages the fact that such traces can be represented as call trees (tree structures), using a deep neural network model to identify areas (spans) where anomalies occur50.
Approaches Not Fully Covered Link to heading
There are many other approaches that could not be introduced in detail in this article due to various reasons, such as not being explicitly mentioned as deployed in production, being of lower importance, or myself not fully reading them. This list is likely only a portion, but if you are interested, please check them out.
| Year | Project Name and Link | Description |
|---|---|---|
| 2012 | (Link Only) | System to detect performance issues in online services using data mining methods |
| 2012 | NetPilot | System to detect and safely automatically mitigate data center network failures |
| 2014 | HMRF | Method to detect performance issues from metrics |
| 2017 | CorrOpt | Monitoring system for detecting packet corruption in data center networks |
| 2017 | GraphWeaver | Incident association method implemented in Microsoft Defender XDR |
| 2018 | Panorama | Monitoring system to detect partial failures and performance degradations like gray faults and limplock |
| 2019 | ATAD | Transfer learning anomaly detection model for telemetry with scarce training data |
| 2019 | BlameIt | Monitoring system to identify WAN latency issues and their causes (ISP or WAN) |
| 2019 | NetBouncer | Monitoring system to detect link failures (device failures) within data center networks |
| 2019 | SR-CNN | Anomaly detection method introduced in Azure AI Service’s Anomaly Detector |
| 2019 | dShark | Diagnostic tool for capturing packet traces across data center networks |
| 2020 | BRAIN | AIOps-centric platform for incident management |
| 2020 | Decaf | System to assist triage and initial diagnosis of incidents in Microsoft 365 |
| 2020 | Gandalf | Monitoring system to early detect issues arising from deployments of fixes and updates in Azure platform to prevent impact escalation |
| 2020 | Lumos | Library to reduce false positives in existing anomaly detection systems and assist in identifying root causes |
| 2020 | MTAD-GAT | Multivariate anomaly detection for time series data using graph neural networks, introduced in Azure AI Service’s Anomaly Detector |
| 2021 | CARE | Automated RCA system used in Microsoft 365 services |
| 2022 | MTHC | Method to classify causes of disk failures used in Microsoft 365’s disk failure prediction system |
| 2022 | NENYA | Monitoring system for predictive mitigation and reinforcement learning-based policy adjustment for databases in Microsoft 365 |
| 2022 | T-SMOTE | Framework for training time series models aimed at early prediction of far-future anomalies, deployed in Azure and Microsoft 365 |
| 2023 | Diffusion+ | Method for imputing missing data for disk failure prediction in Microsoft 365 |
| 2023 | EDITS | Curriculum learning method for training failure prediction models, deployed in services of Azure and Microsoft 365 |
| 2023 | HRLHF | Automated RCA system introduced in Microsoft 365’s Exchange services |
| 2023 | Hyrax | Fail-in-place paradigm for keeping partially failed servers operational |
| 2023 | STEAM | Tail sampling method for distributed traces using graph contrastive learning |
| 2023 | TraceDiag | Automated RCA system introduced in Microsoft 365’s Exchange services |
| 2023 | iPACK | Method to aggregate support tickets for the same issue based on alert information |
| 2024 | AIOpsLab | Prototype implementation of an agent-based AIOps platform to streamline incident response |
| 2024 | Automated Root Causing | Automated RCA system using context-based learning (ICL) with LLM |
| 2024 | Early Bird | Framework for training time series models aimed at early prediction of far-future anomalies |
| 2024 | FCVAE | VAE-based network failure detection |
| 2024 | FLASH | AI agent-based incident management system performing step-by-step troubleshooting |
| 2024 | ImDiffusion | Multivariate time series anomaly detection system using time series imputation and diffusion models for Microsoft’s email delivery service |
| 2024 | NetVigil | Anomaly detection system for east-west data center traffic using graph neural network-based contrastive learning methods |
| 2024 | ReAct | Prototype RCA diagnosis system using LLM-based AI agents |
| 2024 | SWARM | System for ranking DCN failure mitigation measures based on connection quality (CLP) |
This table includes a variety of advanced, experimental, and lesser-known systems. For full details, please explore the provided links.
References Link to heading
- Cloud Intelligence/AIOps – Infusing AI into Cloud Computing Systems - Microsoft Research
- Building toward more autonomous and proactive cloud technologies with AI - Microsoft Research
- Automatic post-deployment management of cloud applications - Microsoft Research
- Using AI for tiered cloud platform operation - Microsoft Research
- Episode 459 - AIOps - YouTube (@The Azure Podcast)
Predicting Node Failure in Cloud Service Systems - Microsoft Research ↩︎
Can We Trust Auto-Mitigation? Improving Cloud Failure Prediction with Uncertain Positive Learning - Microsoft Research ↩︎
Improving Service Availability of Cloud Systems by Predicting Disk Error - Microsoft Research ↩︎
NTAM: Neighborhood-Temporal Attention Model for Disk Failure Prediction in Cloud Platforms - Microsoft Research ↩︎
Neural Feature Search: A Neural Architecture for Automated Feature Engineering | IEEE Conference Publication | IEEE Xplore ↩︎
PULNS: Positive-Unlabeled Learning with Effective Negative Sample Selector | Proceedings of the AAAI Conference on Artificial Intelligence ↩︎
Improving Azure Virtual Machine resiliency with predictive ML and live migration | Microsoft Azure Blog ↩︎
Narya: Predictive and Adaptive Failure Mitigation to Avert Production Cloud VM Interruptions - Microsoft Research ↩︎
Advancing failure prediction and mitigation—introducing Narya | Azure Blog | Microsoft Azure ↩︎
AIR (Annual Interruption Rate) for VM is defined as the average number of interruptive events on 100 VMs over one year. ↩︎
F3: Fault Forecasting Framework for Cloud Systems - Microsoft Research ↩︎
Inside Azure innovations with Mark Russinovich | BRK290HFS ↩︎
Inside Microsoft AI innovation with Mark Russinovich | BRK256 ↩︎
Exploring the Inner Workings of Azures Advanced AI Infrastructure Presented by Microsoft ↩︎
Accelerating industry-wide innovations in datacenter infrastructure and security | Microsoft Azure Blog ↩︎
1. Overview — NVIDIA GPU Memory Error Management r555 documentation ↩︎
SuperBench: Improving Cloud AI Infrastructure Reliability with Proactive Validation - Microsoft Research ↩︎
Anti-Patterns of System Operations - Solving Organizational, Automation, and Communication Problems with DevOps'. ↩︎
Detection Is Better Than Cure: A Cloud Incidents Perspective - Microsoft Research ↩︎
[2308.00393] A Survey of Time Series Anomaly Detection Methods in the AIOps Domain ↩︎
MonitorAssistant: Simplifying Cloud Service Monitoring via Large Language Models - Microsoft Research ↩︎
In the Azure ecosystem, these are referred to as dimensions. ↩︎
iDice: Problem Identification for Emerging Issues - Microsoft Research ↩︎
Efficient incident identification from multi-dimensional issue reports via meta-heuristic search - Microsoft Research ↩︎
Advancing anomaly detection with AIOps—introducing AiDice | Microsoft Azure Blog ↩︎
HALO: Hierarchy-aware Fault Localization for Cloud Systems - Microsoft Research ↩︎
Advancing safe deployment with AIOps—introducing Gandalf | Microsoft Azure Blog ↩︎
Outage Prediction and Diagnosis for Cloud Service Systems - Microsoft Research ↩︎
Fighting the Fog of War: Automated Incident Detection for Cloud Systems - Microsoft Research ↩︎
Assess and Summarize: Improve Outage Understanding with Large Language Models - Microsoft Research ↩︎
Identifying linked incidents in large-scale online service systems - Microsoft Research ↩︎ ↩︎ ↩︎
Efficient customer incident triage via linking with system incidents | Proceedings of the 28th ACM Joint Meeting on European Software Engineering Conference and Symposium on the Foundations of Software Engineering ↩︎ ↩︎
An Empirical Investigation of Incident Triage for Online Service Systems - Microsoft Research ↩︎ ↩︎
Continuous incident triage for large-scale online service systems | Proceedings of the 34th IEEE/ACM International Conference on Automated Software Engineering ↩︎
DeepTriage | Proceedings of the 26th ACM SIGKDD International Conference on Knowledge Discovery & Data Mining ↩︎
Welcome to LightGBM’s documentation! — LightGBM 4.5.0 documentation ↩︎
How incidental are the incidents? | Proceedings of the 35th IEEE/ACM International Conference on Automated Software Engineering ↩︎
How Long Will it Take to Mitigate this Incident for Online Service Systems? - Microsoft Research ↩︎
Large Language Models Can Provide Accurate and Interpretable Incident Triage - Microsoft Research ↩︎
If you want to learn how to write KQL, “Kusto 100 Knocks” is recommended. Reference: KUSTO 100+ knocks ↩︎
Xpert: Empowering Incident Management with Query Recommendations via Large Language Models - Microsoft Research ↩︎
LLexus: an AI agent system for incident management - Microsoft Research ↩︎
Automatic Root Cause Analysis via Large Language Models for Cloud Incidents - Microsoft Research ↩︎
Log2: A Cost-Aware Logging Mechanism for Performance Diagnosis - Microsoft Research ↩︎
Log Clustering based Problem Identification for Online Service Systems - Microsoft Research ↩︎
Identifying Impactful Service System Problems via Log Analysis - Microsoft Research ↩︎
Onion: Identifying Incident-indicating Logs for Cloud Systems - Microsoft Research ↩︎
UniParser: A Unified Log Parser for Heterogeneous Log Data - Microsoft Research ↩︎
SPINE: A Scalable Log Parser with Feedback Guidance - Microsoft Research ↩︎
TraceLingo: Trace representation and learning for performance issue diagnosis in cloud services | IEEE Conference Publication | IEEE Xplore ↩︎